Virtual Reality for caregiver training
Assess the effectiveness of using Virtual Reality for caregiver training
Urban Health Pathway Seed Grant. PI: Ming Tang. Partner. Council on Ageing, LiveWell Collaborative. $19,844. 03. 2021-3.2022
Presentation:
- Tang, Ming, Jai’La Nored, Matt Anthony, Judy Eschmann, Jennifer Williams, and Linda Dunseath. “VR-based Empathy Experience for Nonprofessional Caregiver Training.” In: De Paolis, L.T., Arpaia, P., Sacco, M. (eds) Extended Reality. XR Salento 2024. Lecture Notes in Computer Science, vol 15028. Springer, Cham. https://doi.org/10.1007/978-3-031-71704-8_28
- EVRTalk on iHeart;
- Cincinnati Public Radio interview
- 4oA conference & demo
- o4a AAA Partnership Award


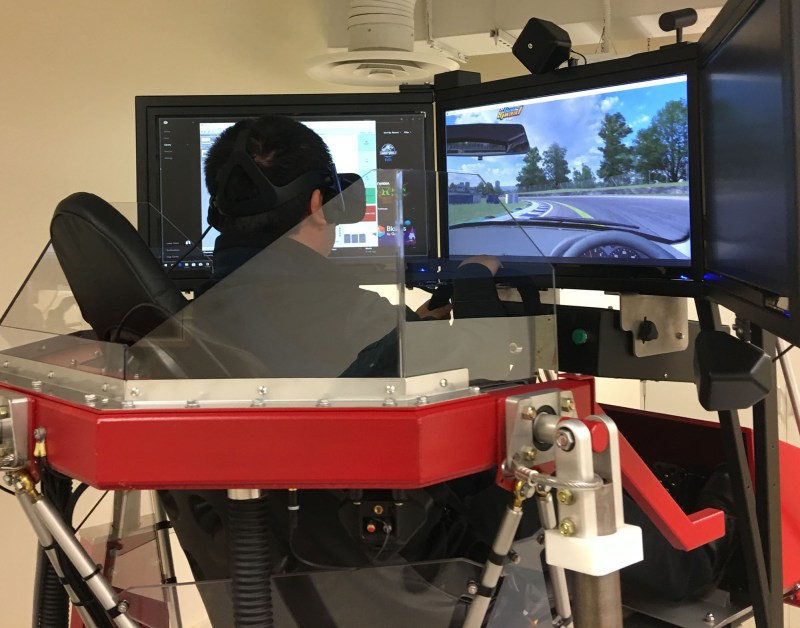
This project investigates the effectiveness of using Virtual Reality to build empathy for the care recipient by allowing the caregiver to experience day-to-day life from the care recipient’s perspective. Ming Tang leads a research team working with COA and LiveWell Collaborative to develop and evaluate an expandable set of VR training modules designed to help train family and friends thrust into the caregiving role. Ming Tang led the LWC team and designed the simulated decision trees, scenarios, and hand-tracking technologies in an immersive VR environment.
Team members: Ming Tang, Matt Anthony, Craig Vogel, Linda Dunseath, Alejandro Robledo, Tosha Bapat, Karly Camerer, Jay Heyne, Harper Lamb, Jordan Owens, Ruby Qji, Matthew Spoleti, Lauren Southwood, Ryan Tinney, Keeton Yost, Dongrui Zhu


COA was awarded $25,000 from the CTA Foundation Grant in 2021.
![]()
In the UC News. Share point.